
Over the last five years, the adoption of digital payments in India has increased at an impressive rate. The Reserve Bank of India’s (RBI) digital payments index (DPI) increased to 349 in March 2022, 15% up from 304 in September 2021, indicating the country’s growing use of digital payments.
What is RBI’s Digital Payment Index?
The DPI index went live in January 2021. It assesses the country’s level of payment digitalisation. The RBI-DPI is released bi-annually (capturing data for March and September months) and consists of the following five parameters that measure the depth and penetration of digital payments across the country over various periods.
- Payment enablers
- Payment infrastructure – demand-side factors
- Payment infrastructure – supply-side factors
- Payment performance
- Consumer centricity
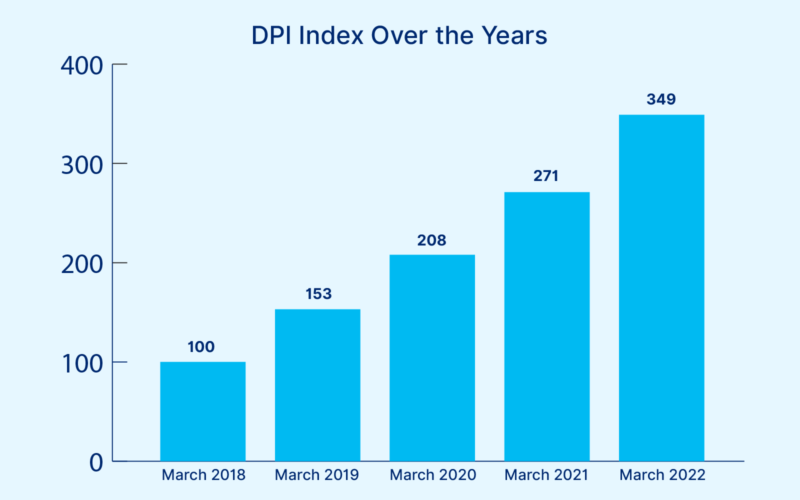
The DPI is calculated based on the above broad parameters and many sub-parameters. The following graph shows how digital payments have grown over the past five years in the country.
Source: RBI
India’s Digital Payment Index was 153 in March 2019 and had risen to 208 in March 2020, followed by 271 in March 2021 and 349 in March 2022. The data for September 2022 is yet to be released. The index has climbed at an average annual rate of about 37 per cent over the past five years. This is one of the fastest growth rates in the world.
The Key Accelerator – Unified Payments Interface (UPI)
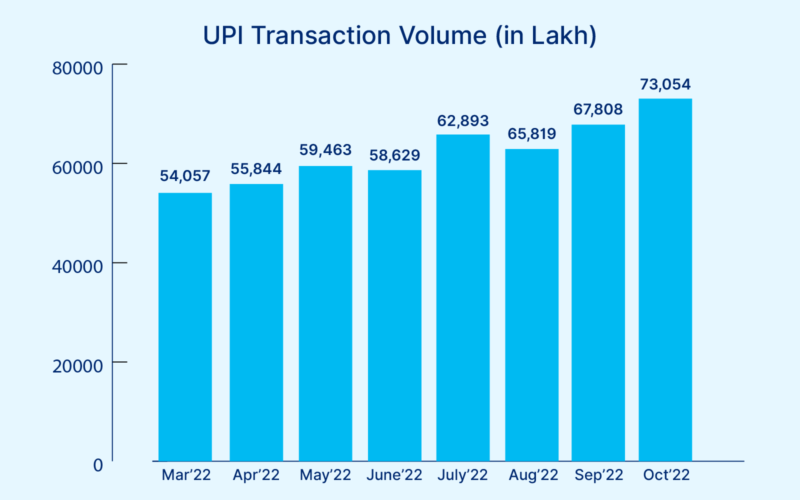
The adoption of digital payments has been more rapid, primarily driven by the unique, real-time, homegrown, mobile-enabled system – UPI. The following graph gives a snapshot of UPI transaction volumes for this year:
Source: RBI
UPI transaction volumes increased 98% year on year to 54,057 lakhs in March 2022, while the total number of participating banks has grown by 45% to 314. During the same period, the UPI transaction values increased by 90% as well.
Furthermore, the RBI introduced UPI for feature phones in March, which may potentially bring in 400 million users from remote rural areas.
According to the latest data released by NPCI, the UPI transaction volumes grew by 35% to 73,054 lakhs in October 2022 from March 2022. During the same period, the UPI transaction values increased by 26% as well. The total number of participating banks grew by 16% to 365 during the same period.
Also Read: Growth of UPI Ecosystem: A Homegrown Technology Ready to Conquer the World
Credit Card Payments have Increased
Source: RBI
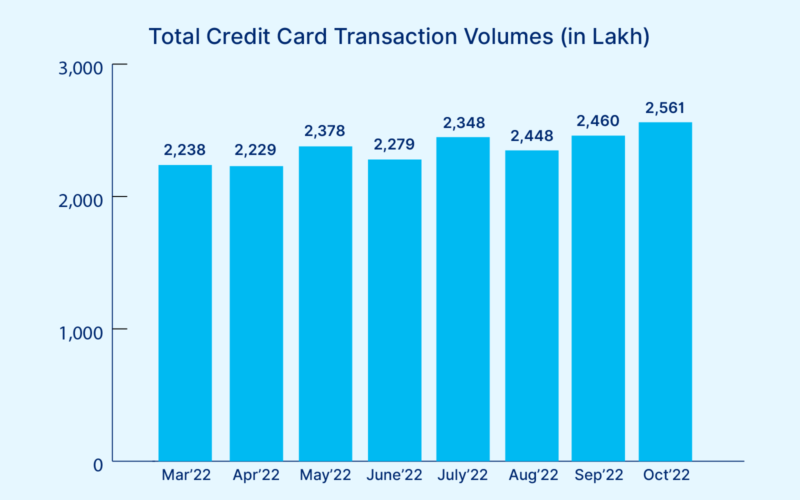
Total credit card transaction volumes increased by 19% year on year to 2,238 lakhs in March 2022. During the same period, the transaction values increased by 48% as well.
As per the latest data released by the RBI, credit card transaction volumes increased by 14% to 2,561 lakhs in October 2022 from March 2022. However, the transaction values increased by 21% during the same period.
Debit Card Transactions have Decreased
Source: RBI
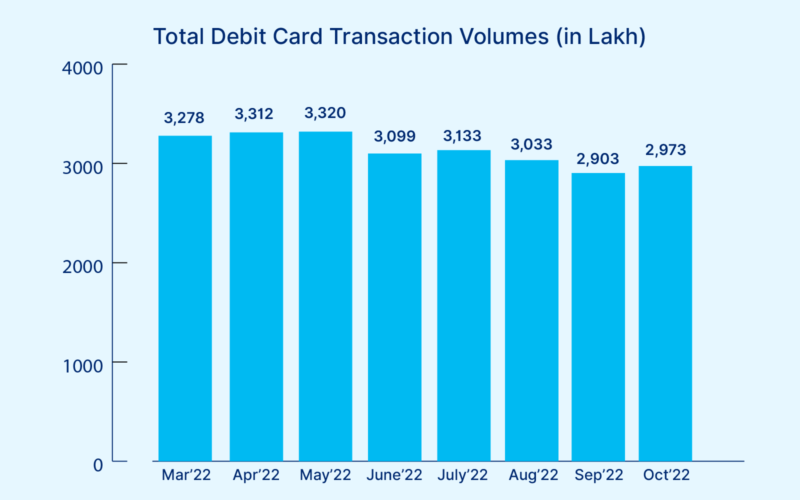
Total debit card transaction volumes decreased by 13% year on year to 3,278 lakhs in March 2022. During the same period, the transaction values also de-grew by 5%.
According to the latest data released by the RBI, debit card transaction volumes decreased by 9% to 2,973 lakhs in October 2022 from March 2022. However, the transaction values increased by 5% during the same period.
Digital Wallet-Based Transactions have Dropped, Slightly
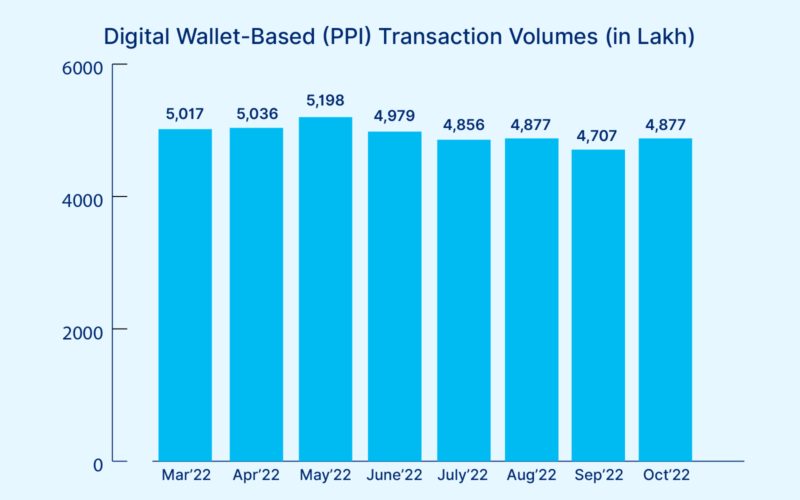
Source: RBI
Digital wallet-based transaction volumes increased by 20% year-on-year to 5,017 lakhs in March 2022. During the same period, the transaction values increased by 35% as well.
As per the latest data released by the RBI, digital wallet-based transaction volumes de-grew by 3% to 4,877 lakhs in October 2022 from March 2022. During the same period, the transaction values decreased by 8% as well.
Cash Withdrawals at ATMs have Increased Marginally

Source: RBI
The transaction volume of cash withdrawals at ATMs has increased by 6% to 6,119 lakhs in October 2022 from March 2022. During the same period, the transaction value of cash withdrawals at ATMs increased by 4%.
Debit cards primarily drive cash withdrawals at ATMs. They made 99.45% of the cash withdrawals in October 2022 and 99.47% in March 2022.
Credit cards made only 0.12% of the total withdrawals in March 2022 and October 2022. Prepaid cards made 0.40% of the cash withdrawals in March 2022, and they contributed 0% in October 2022.

Contribution of Different Payment Sources in Total Digital Payments in 2022
Here is a snapshot of how much different payment sources have contributed to the total digital payments that have happened so far this financial year:
| Payment Source | UPI | Credit Card | Debit Card | Digital Wallet | Others* | Total |
| Mar 2022 | 67.81% | 2.81% | 4.11% | 6.29% | 18.98% | 100% |
| Apr 2022 | 69.67% | 2.78% | 4.13% | 6.28% | 17.14% | 100% |
| May 2022 | 69.21% | 2.77% | 3.86% | 6.05% | 18.10% | 100% |
| Jun 2022 | 70.66% | 2.75% | 3.73% | 6.00% | 16.86% | 100% |
| Jul 2022 | 71.67% | 2.68% | 3.57% | 5.53% | 16.55% | 100% |
| Aug 2022 | 72.67% | 2.69% | 3.34% | 5.37% | 16.15% | 100% |
| Sep 2022 | 73.36% | 2.66% | 3.14% | 5.09% | 15.74% | 100% |
| Oct 2022 | 73.84 | 2.59% | 3.00% | 4.93% | 15.64% | 100% |
Source: RBI
*(includes PPI cards, paper-based instruments, debit/credit transfers, etc.)
The contribution of UPI in the total digital payments has increased by 9% in October 2022 compared to March 2022. On the other hand, the share of credit cards, debit cards, and digital wallets has decreased until now in this financial year.
The contribution to the total digital payments by credit cards has decreased by 8%, debit cards by 27%, and digital wallets by 22%. Other digital payment sources, such as PPI cards, paper-based instruments, debit/credit transfers, etc., have decreased their share by 18%.
Other digital payment sources include several key sources, including alternate payment sources such as Buy Now, Pay Later (BNPL). The data published by the RBI does not clearly state the share of BNPL transactions in the total digital payments.
Also Read: Where is ‘Buy Now, Pay Later’ (BNPL) Headed? Here’s the Indian Context
However, various studies show that BNPL has emerged as one of the preferred modes of payment among millennials and will continue to grow in the future. Here is a snapshot of transaction volumes projected by PwC for past and future financial years:
BNPL will Continue to Grow
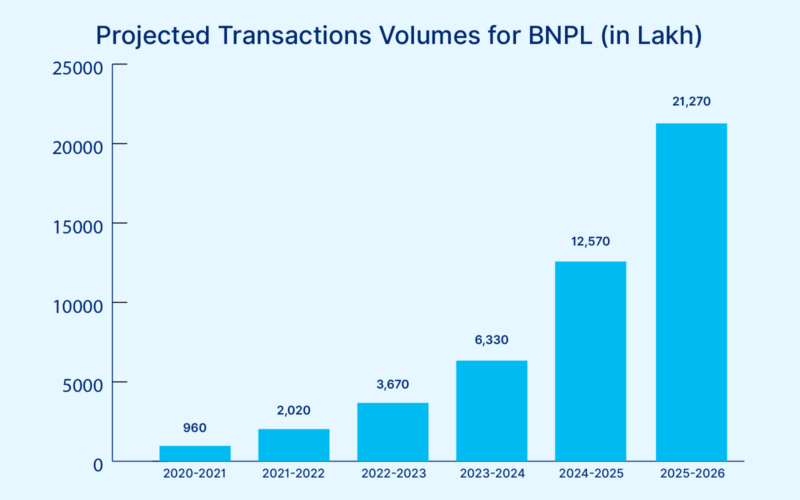
According to a report by PwC, BNPL is projected to see a multifold increase in adoption among Indians. The report suggests that the BNPL transaction volumes will see an 82% growth in the 2022-23 FY compared to the previous FY.
In FY 2023-24, BNPL transaction volumes will increase by 72% to 6,330 lakhs. The growth trend will gain momentum, with transaction volumes growing at 99% in 2024-25 and 69% in 2025-26.
Want to read more such interesting stuff and the latest updates on Fintech?